When you access XTENDISE for the first time, you will be presented with the dashboard which gives you a basic overview of XTENDISE and your ISE Deployment.
In the header, you can find navigation to XTENDISE features. On the right, you can find Fast search to quickly find a MAC address and administration.
Dashboard provides three pills:
- Overview
- Endpoints
- Compliance
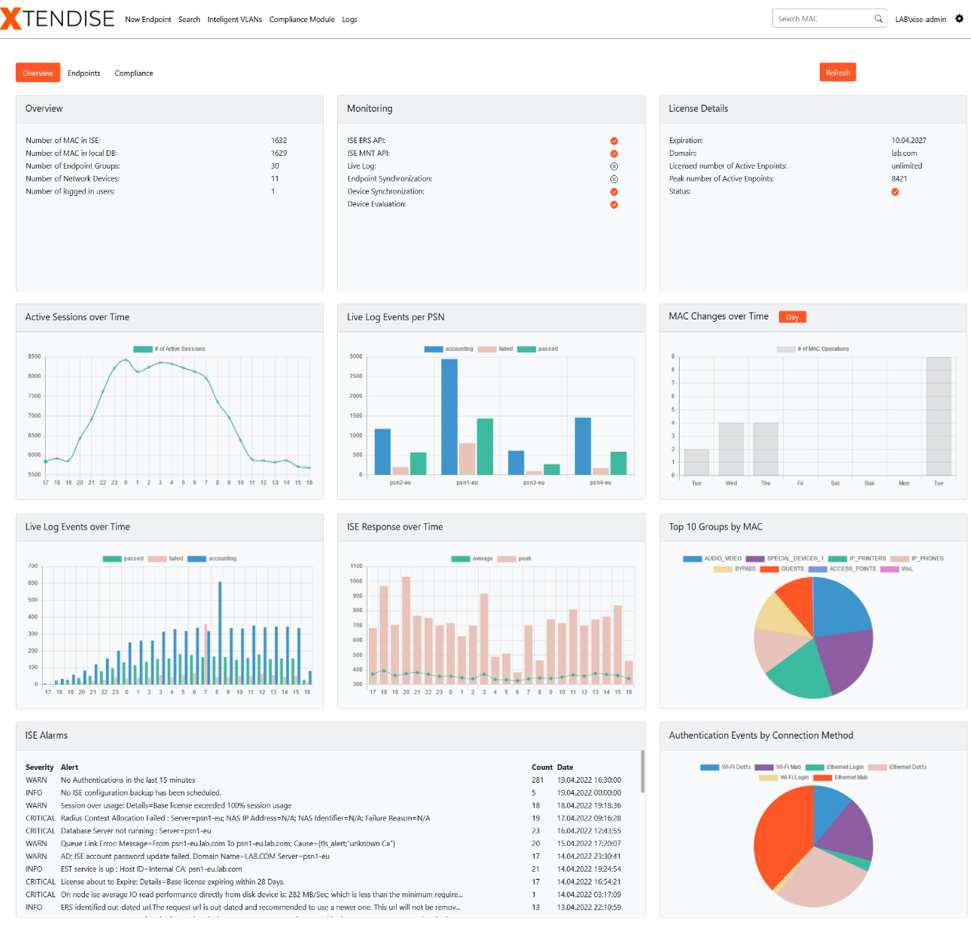
Overview
Overview tab provides multiple widgets with monitoring and statistical data about your ISE deployment in the last 24 hours. You can find these data useful when troubleshooting your ISE Deployment in order to quickly identify an anomaly behavior.
- Monitoring - Provides basic monitoring status of XTENDISE application such as connection to ISE ERS and MNT APIs and incoming Live log messages. Endpoint and Device checks monitors if corresponding Jobs are enabled
- Live Log Events per PSN - Provides information about the load on PSN servers. The widget provides number of passed, failed and accounting messages processed by individual servers
- MAC Changes over Time - Provides number of MAC events (create, edit, delete) over the time
- Live Log Events over Time - Displays number of passed, failed and accounting messages processed by all servers in time
- ISE Response over Time - XTENDISE queries ISE ERS API every minute with a monitoring probe. The widget displays peak and average response time. The average value should not exceed 2500ms. Higher values can point to ISE performance issues.
- Authentication Events by Connection Method - Displays number of passed and failed authentication messages by various connection methods such as MAB or DOT1X and Ethernet or Wi-Fi.
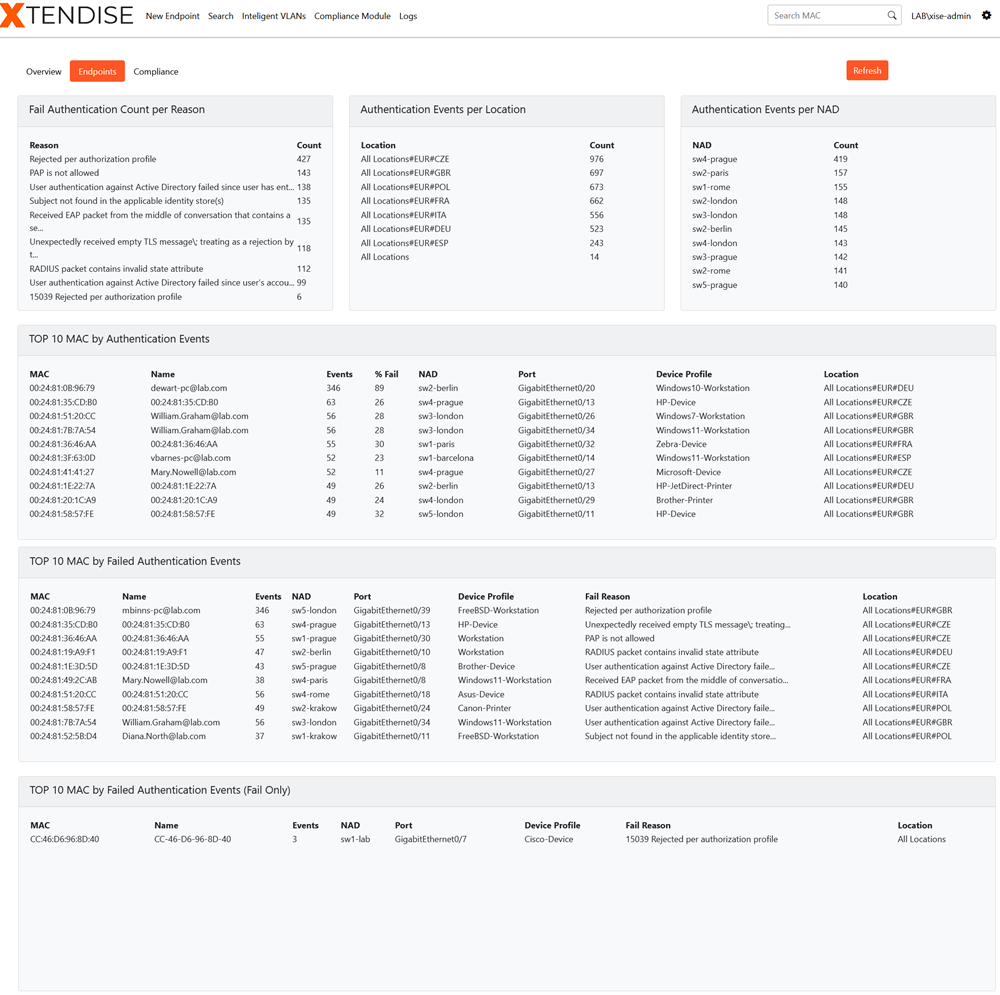
Endpoints
Endpoints tab provides authentication events grouped by various parameters such as number of failed authentications, Device location, or NAD. There are also TOP 10 widgets grouped by individual MAC addresses which provide information about anomalous or misbehaving MAC addresses. Widgets are enriched with additional information such as device profile or NAD, switchport, and location. Widgets display Live Log data collected in the last 24 hours.
-
TOP 10 MAC by Authentication Events - Provides number of passed or failed authentication events for a MAC address.
-
TOP 10 MAC by Failed Authentication Events - Provides number of failed authentication events for a MAC address. These MAC addresses can also have passed authentications and thus can be flapping.
-
TOP 10 MAC by Failed Authentication Events (Fail Only) - Provides number of failed authentication events for a MAC address. These MAC addresses do not have any successful authentication and thus should be removed from the network.
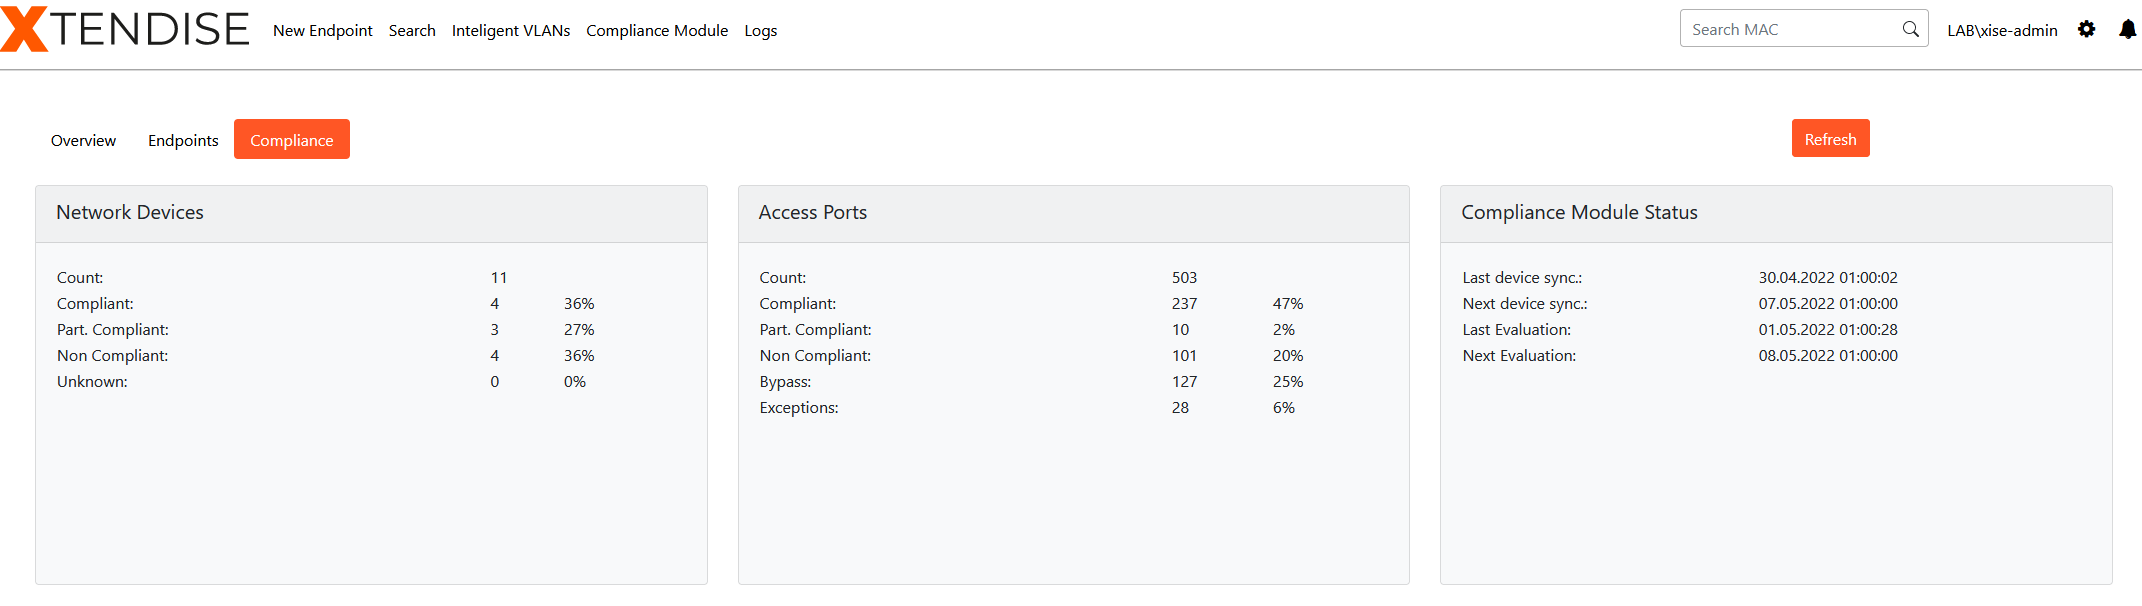
Compliance
The compliance tab provides widgets with compliance module information. It provides information about the compliance status of your network devices and their switchports and the last and the next date of evaluation.